
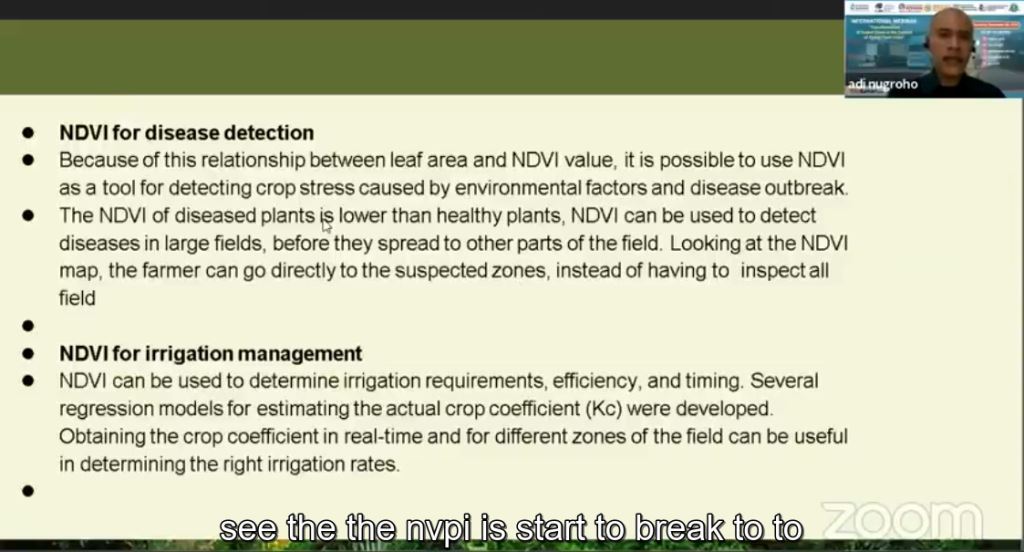
In his presentation on the food crisis and its solutions, Mr. Adi explained that one of the causes of the food crisis was crop failure caused by disease. However, digital image analysis can be used to detect diseases in agriculture so that their handling can be more precise. NDVI can be used for disease detection in agriculture. This is probably the most common use of NDVI today. Due to this relationship between leaf area and NDVI value, NDVI can be used as a tool to detect plant stress caused by environmental factors and disease outbreaks.
The NDVI of diseased plants is lower than that of healthy plants, which means it can be used as a proxy for plant health. When combined with other data, such as leaf area index or chlorophyll content, NDVI can be used to detect disease in large fields, before it spreads to other parts of the field. Note that identification of certain diseases cannot be achieved with NDVI.
Identification of certain diseases may not be achieved with NDVI. However, areas affected by the disease in the field will have low NDVI values. By looking at the NDVI map, farmers can go directly to suspected zones, instead of having to check the entire field.
NDVI, or Normalized Difference Vegetation Index, is a tool used to monitor plant health and growth. It is a measure of surface greenery and provides an automated way to monitor plant development and health throughout the growing season. The advantage of using NDVI over traditional methods, such as chlorophyll fluorescence, is that it can be measured from space or by drone, without the need for on-site equipment.
The use of NDVI as a crop monitoring tool has been well studied over the last decades, and has proven to be an effective tool for many applications. Several models have been developed to use NDVI to predict plant biomass and yield, manage nitrogen fertilization, irrigation management and other uses. Colored maps, showing variability in the field can be produced based on NDVI values.
NDVI is obtained by measuring the difference between reflected near-infrared light and reflected visible red light and calculating it by the total amount of radiation emitted from the earth's surface:
NDVI = (NIR – RED)/(NIR + RED)
Green plants absorb light energy from their environment and use it to synthesize sugars and other organic compounds. As a result, they reflect more near infrared light and absorb visible red light. In general, higher values indicate more healthy vegetation or plants, while lower values indicate less healthy plants or plants that are not growing properly. NDVI values between 0 and 1 are generally considered optimal for plant growth; a value less than 0 indicates an area with too little vegetation for photosynthesis to occur effectively (such as during a drought). While the negative NDVI value corresponds to the character of the digital image of water.
The presenter who delivered the material was Mr. Adi Nugroho who is a graphic design lecturer at STEKOM University, Indonesia. The title of the presentation presented by Mr. Adi was "Digital Imaging Role in Information Technology Against Food Crysis". This material was presented at an international webinar organized by the University of Science & Computer Technology (STEKOM University) in collaboration with the Karachi Institute of Economics & Technology (Pakistan), Universiti Malaysia Perlis (Malaysia), STIE STEKOM, Association of Industrial and Vocational Communities (PERKIVI), Indonesian Smart Teacherpreneur Association (PTIC) and TopLoker.com. The webinar will be held on December 8, 2022 online using zoom media. All scheduled international presenters managed to attend and fill in the material properly.
The webinar activity is part of the implementation of STEKOM University's commitment to increase various international activities in order to realize the vision to become an international-class university. Various international activities carried out by STEKOM University continue from year to year. There are international activities that are sustainable and there are also some international activities that are not sustainable. All types of international activities are accommodated and regulated by the International department of STEKOM University.
International Webinar 2022 - Transformation of Export Flows in the Context of Global Food Crisis - Part 27
International Webinar
Kembali ke Berita
International Webinar
Senin, 2 Januari 2023
Priyadi, S.Kom, M.Kom
0 Dilihat