
A statechart is a diagram that describes a state machine. At first glance, this statement is quite confusing, but don't worry, in this paper we will discuss statechart diagrams in full, from definitions to examples. In practice statechart diagrams are very rarely used, even some people who study information systems do not know about this.
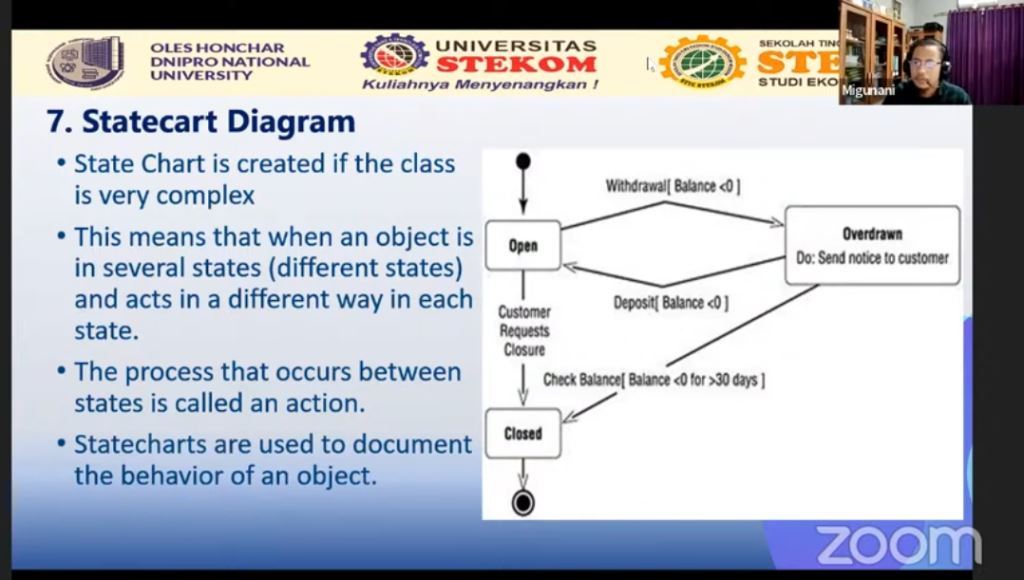
Statechart or state diagram is a diagram that describes, shows and describes the behavior of the system. In general, this statechart diagram describes all existing conditions as an object or event. The elements contained in the state diagram are boxes that describe an object, as well as arrows as pointers to move to another state.
The difference between statechart diagrams and flowchart diagrams is clearly visible because they have different functions. As we know, a flowchart is a diagram that describes the processes that run on a system. Meanwhile, statechart diagrams are used to show changes to a state, which make these changes not processes or orders. Apart from these two things, flowcharts and statecharts have significant differences. For example in making flowcharts we are required to know so many symbols.
The following is the notation used in a statechart diagram:
1. Transition.
Transitions are images of an arrow indicating the path to different parts of the state of an object. Transitions not only lead to other states, but can point back to themselves.
2. Initial State.
An arrow pointing at the circle.
3. Final States.
This notation shows represents the final state of the object.
4. Synchronization and Splitting of Control.
The splitting process is named with a fork, where a single transition or one transition is divided into several transitions. Meanwhile, the Synchonization process is named join, in which two transitions merge into one transition.
5. States.
States is a notation describing a condition that occurs on an object.
At first glance this statechart diagram looks simple and easy, but when we want to draw and make it we are required to follow the following steps.
- Identification of objects that are important to analyze
- Identify states
- Identify events
After we are able to do the three things above, the next thing is to think about state objects, for example in product e-commerce. In general, products in an e-commerce have a release date available, sold, stock or supplies and so on. Whereas for a transition in certain circumstances it does not apply, for example when the product is purchased or sold out.
The above material was delivered by a presenter from Indonesia in an international visiting lecturer held by STEKOM University in collaboration with Universities from Ukraine. The title of the presentation is "Engineering in the Software Development Model". The name of the presenter is Migunani Hudayatullah, S.Kom., M.Kom. Mr. Migunanani is an active lecturer and head of the Information Systems study program at STEKOM University.
This international webinar activity is part of the implementation of STEKOM University's commitment to increase various international activities. This was done in order to realize the vision to become an international-class university. Various international activities carried out by STEKOM University continue from year to year. There are international activities that are sustainable and there are also some international activities that are not sustainable. All types of international activities are accommodated and regulated by the International department of STEKOM University.
Visiting Lecturer from STEKOM University with Oles Honchar Dnipro National University (Ukraine) part 10
Visiting Lecturer
Kembali ke Berita
Visiting Lecturer
Rabu, 3 Mei 2023
Priyadi, S.Kom, M.Kom
0 Dilihat