
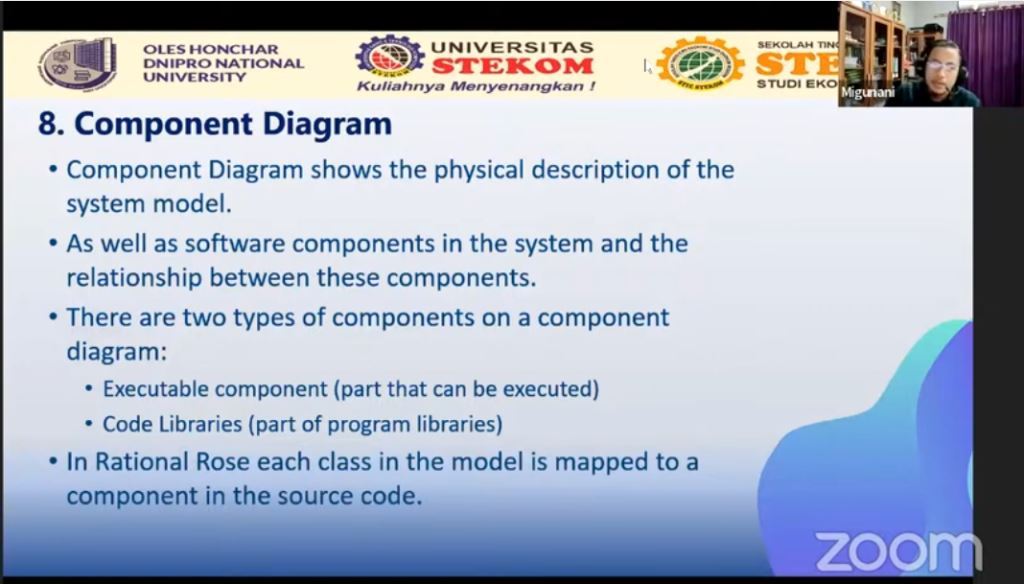
Component diagram is something that is used to show an organization and the interrelationships and dependencies between a collection of components in a system. While the understanding of component diagrams based on UML is as follows: "the physical thing of the system that is modeled when the system is executed". Examples of basic component diagrams include the following.
- Data components used to manipulate data.
- Business processing components used to handle business processes.
- Security components used in handling security.
- User interface components used in handling the appearance of a system.
After we make a system component diagram, the next step is to make a deployment diagram, this is of course no less important.
A component diagram is made based on the following uses.
- As a software source code (software).
- Executable components that are removed and used by the user.
- Part of the database physically.
- Systems that must be adapted to other systems.
- As a system framework, which in this case has the goal of facilitating the maintenance and management of the system.
The following are the symbols that are owned by the component diagram. If we compare it with a flowchart, of course it has more symbols. This should be easier for us to remember and understand.
- Package diagram symbol.
Package is a symbol used to encapsulate components.
- Component diagrams.
Component system is a symbol that describes the hardware or objects in the system.
- Dependency symbols
A symbol that describes a dependency between components, one component to another. The direction of the arrow in the symbol is directed to the component used. Interface or interface.
- Interface symbols.
This is similar to object-oriented programming, where this symbol is used for interfaces with the aim of not directly accessing objects.
- Link symbol
This link symbol is used to show the relationship between components, if a component has a relationship or connection with other components then this link symbol is used.
The following are easy steps in compiling or creating component diagrams
- Understand component diagram symbols
Understand in advance every symbol used in component diagrams
- Read data
Read the data carefully that will be used as a component diagram.
- Draw component diagrams
Draw component diagrams using easy tools or software.
The above material was delivered by a presenter from Indonesia in an international visiting lecturer held by STEKOM University in collaboration with Universities from Ukraine. The title of the presentation is "Engineering in the Software Development Model". The name of the presenter is Migunani Hudayatullah, S.Kom., M.Kom. Mr. Migunanani is an active lecturer and head of the Information Systems study program at STEKOM University.
This international webinar activity is part of the implementation of STEKOM University's commitment to increase various international activities. This was done in order to realize the vision to become an international-class university. Various international activities carried out by STEKOM University continue from year to year. There are international activities that are sustainable and there are also some international activities that are not sustainable. All types of international activities are accommodated and regulated by the International department of STEKOM University.
Visiting Lecturer from STEKOM University with Oles Honchar Dnipro National University (Ukraine) part 11
Visiting Lecturer
Kembali ke Berita
Visiting Lecturer
Rabu, 3 Mei 2023
Priyadi, S.Kom, M.Kom
0 Dilihat